ListServ: Snapshot Survey on Collection Coverage
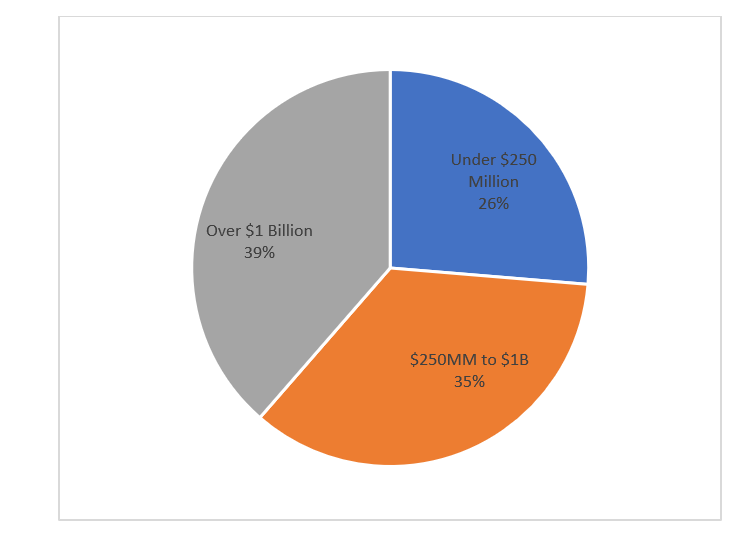
We conducted this survey to cover a gap in our forthcoming Staff Benchmarking Survey. Most of all we, wanted to find out how many accounts were handled by the typical collector. As you can see from the following tables, there is significant variation depending on the sales volume of each company, with smaller firms handling many more accounts per person than larger firms, but there was also a lot of overall variance within each segment.
Unfortunately, we didn’t have enough participants (there were 57) to provide meaningful metrics based on industry type, but rest assured there is clearly variance between industries. We also did not ask about automation (though we did in the Staff Benchmarking survey), which is another factor that will affect how many accounts one collector can easily manage.
One other note: recognizing that many credit department staff members have a collection role, but only spend a portion of their time on it, we asked whether staff members were full-time collectors (spent over 80% of their time on collections), Part-time collectors (10%-80%) or occasional collectors (under 10%) and then allocated the time spent on collections (90%, 45% or 5% respectively) to determine what constitutes a Full-Time Equivalent (FTE) collector across a credit department that may have multiple roles. Admittedly, this is somewhat crude, but in reviewing the raw data it appears to be an effective approach.
Another benefit of this approach, is that for most firms slightly more than 50% of credit department staff time is spent on collections (the average is 60% with the lower quartile at 50% and the upper quartile at 70%). This ratio holds true upon comparison of the following tables: Total Credit Department Employees to Total Dedicated Collectors, and then also Accounts per Credit Department Employee to Accounts per FT Collector.
The bottom line is that we hope these metrics are useful to you when comparing your staffing and collection coverage to your peers. As such, it should provide insights into your AR performance and provide direction for making improvements.
How many active accounts does your Credit and Collections department manage?
|
Revenue Range |
< $250MM |
$250MM to $1B |
>$1B |
All Companies |
|
Top Quartile |
4,500 |
4,550 |
3,000 |
4,500 |
|
Median |
2,050 |
2,200 |
2,000 |
2,000 |
|
Bottom Quartile |
1,300 |
5,50 |
1,000 |
600 |
Total Credit Department Employees:
|
Revenue Range |
< $250MM |
$250MM to $1B |
>$1B |
All Companies |
|
Top Quartile |
5.5 |
12.0 |
16.0 |
12.0 |
|
Median |
3.0 |
5.3 |
12.0 |
5.5 |
|
Bottom Quartile |
2.0 |
2.5 |
8.0 |
3.0 |
Total Dedicated Collectors (FTE) in the Credit Department:
|
Revenue Range |
< $250MM |
$250MM to $1B |
>$1B |
All Companies |
|
Top Quartile |
3.6 |
7.4 |
11.0 |
8.2 |
|
Median |
1.4 |
2.9 |
8.2 |
3.5 |
|
Bottom Quartile |
0.9 |
1.4 |
4.1 |
1.4 |
Accounts per Credit Department Employee:
|
Revenue Range |
< $250MM |
$250MM to $1B |
>$1B |
All Companies |
|
Top Quartile |
1,333 |
750 |
375 |
700 |
|
Median |
324 |
376 |
173 |
273 |
|
Bottom Quartile |
201 |
123 |
90 |
121 |
Accounts per FT Collector:
|
Revenue Range |
< $250MM |
$250MM to $1B |
>$1B |
All Companies |
|
Top Quartile |
2,222 |
1,471 |
714 |
1,385 |
|
Median |
1,115 |
703 |
244 |
446 |
|
Bottom Quartile |
444 |
278 |
115 |
244 |
Which of the following best describes your company's operations/industry?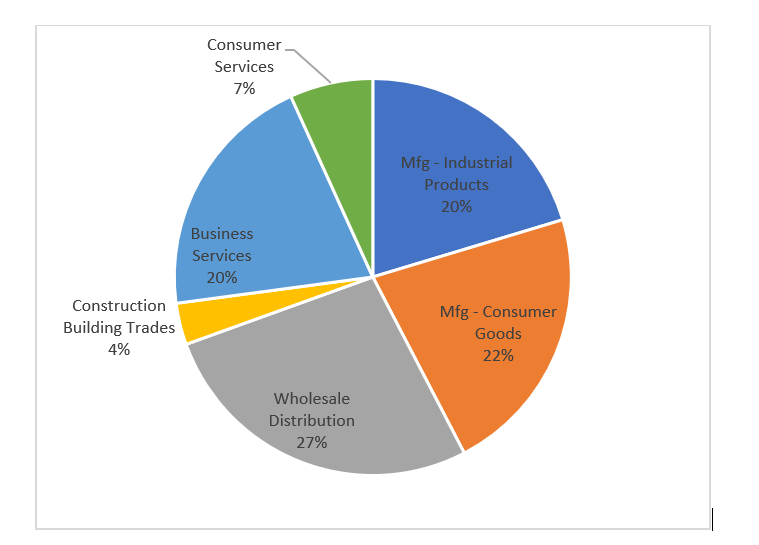
Which of the following best describes your company's operations/industry?