New Metrics That Supplement DSO
By David Schmidt
Days Sales Outstanding (DSO) has always been somewhat of an enigma. The concept behind DSO is fine: to measure how fast your accounts receivables (AR) are turning over. The formula most companies use is:
The problems start with how many days are used in the calculation. If you choose to look at sales for the last three months, you will get different results than if you use year-to-date sales, and another set of results if you use the last twelve months of sales. These are the three most common time periods used, but there is also the Count Back Method, which is popular with some organizations and will yield another completely different set of results over a period of time. Needless to say, if you are benchmarking DSO with some peers, you better make sure you are all on the same page.
Another problem with DSO is that it is affected by how sales are trending (the Count Back Method eliminates some of the sales bias). If sales are increasing month-to-month, DSO will also tend to increase unless you are able to collect more AR than is being created. Even if collection performance is solid, sales will tend to increase. When sales are declining, it is much easier to collect more AR than new sales, and so DSO tends to decline. Because of this sales effect, we have long recommended plotting Sales and AR Balance along with DSO to better understand the factors driving any month-to-month changes in DSO.
In a recent posting by Deloitte, two additional metrics have been recommended to supplement DSO in order to “provide a more comprehensive and actionable picture of working capital and assist management.” The first is weighted-average days to collect (WADTC), and the second is weighted-average terms (WAT).
Using these measures addresses another weakness that can occur with DSO. If your company uses a variety of different length credit terms, DSO can be pushed up or down if there is an increase or decrease in the sales volume to one or more sets of terms regardless of collection performance.
WADTC measures how long it takes a customer to pay its invoices and is weighted according to the size of each invoice. Current ERP and accounting systems collect the data necessary to make this calculation for every paid invoice. WADTC allows you to:
- Understand each customer’s payment patterns
- Identify deviations in payment patterns
- Compare the payment patterns among customers or customer segments over time
This information is “powerful because a company can use it to identify changes in payment timing, workstreams, or focus areas that it needs to address,” according to the post.
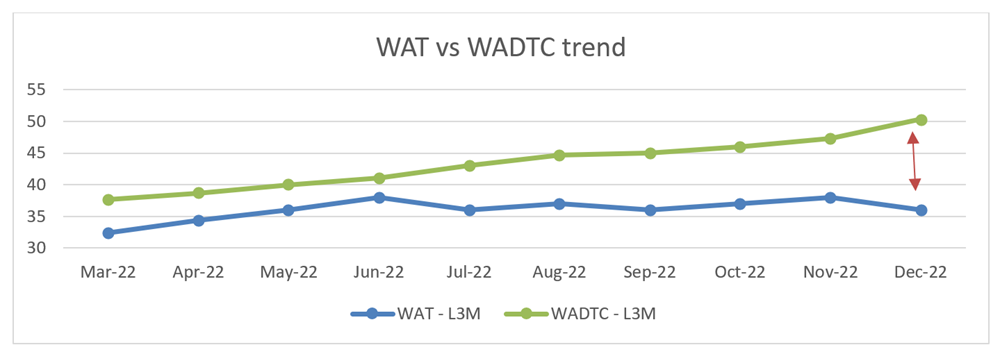
Calculating WAT provides insight into your firm's average contractually-agreed payment terms. For one thing, it enables you to understand the impact of extending the payment terms offered to customers. When used in conjunction with WADTC, it will help you understand if customers are paying as expected or slower than expected. As illustrated in the following chart, when the two metrics are moving closer to each other, payments are accelerating (March through June). In contrast, the metrics are moving apart from June through December, indicating that payments are slowing.
By introducing WADTC and WAT to your credit executives’ toolbox, you are now much better equipped to analyze AR and collections performance. The additional insights you are able to generate will also help you in discussions with your sales team and the company’s financial executives, allowing you to better explain the external factors affecting receivables performance.